80-25
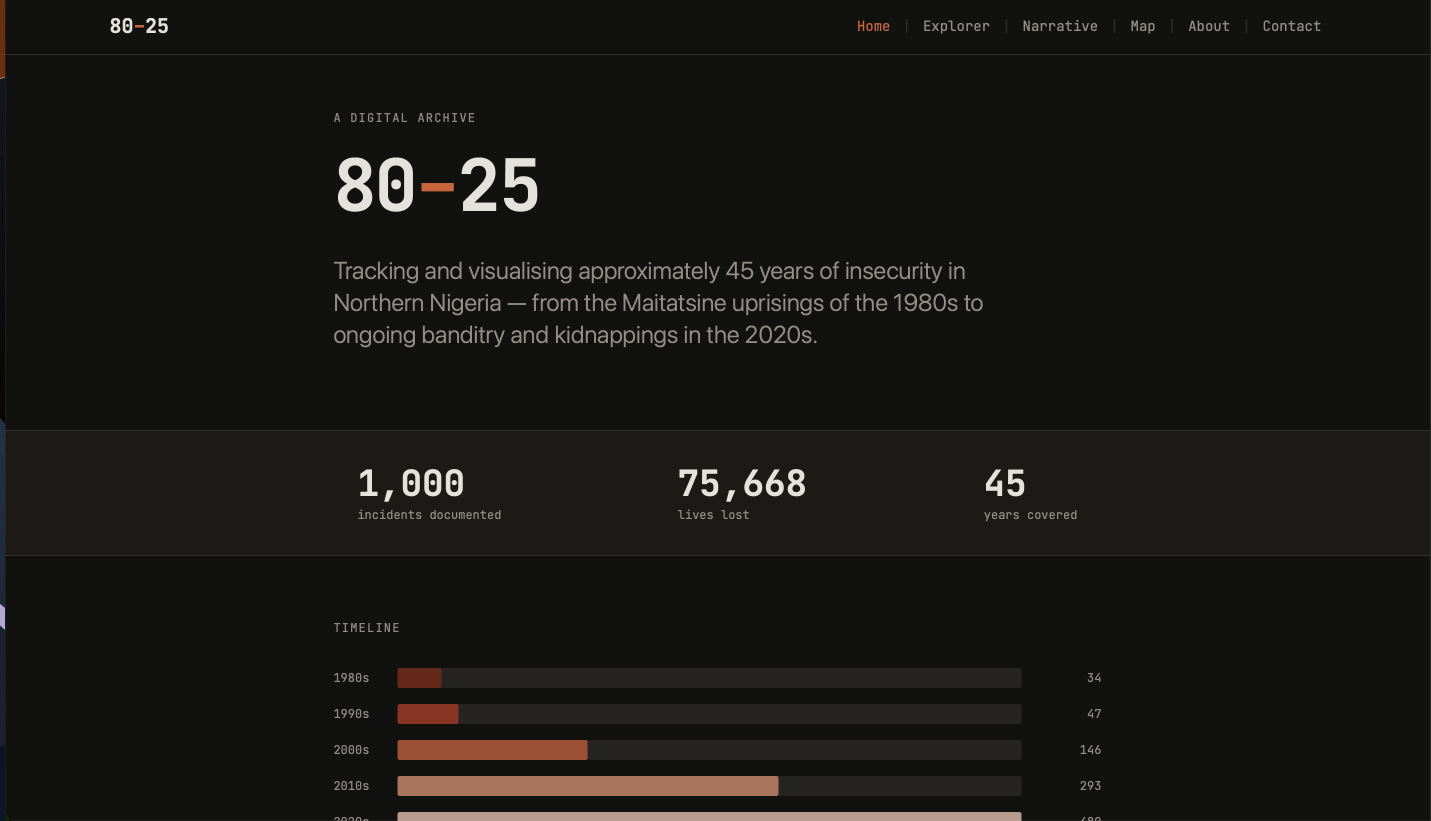
80-25 is a digital archival initiative tracking and visualising 45 years of insecurity in Northern Nigeria, from the Maitatsine uprisings of the 1980s to ongoing banditry and kidnappings. The project combines an interactive incident explorer, a scrollytelling narrative, and a geographic map, all powered by a single curated dataset.
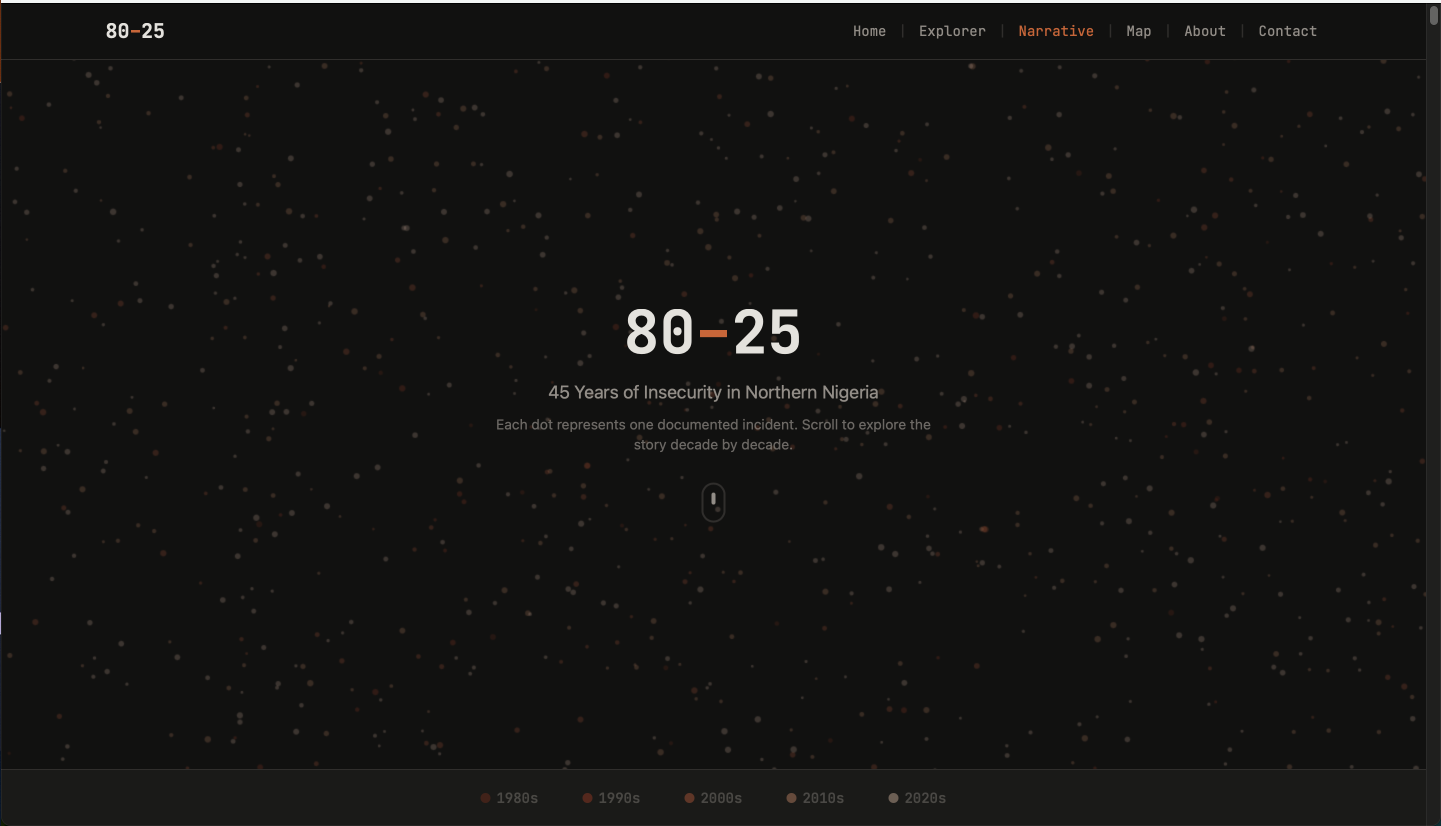
80–25
- The archive. 1,402+ incidents and 27,786+ lives, counted across 45 years.
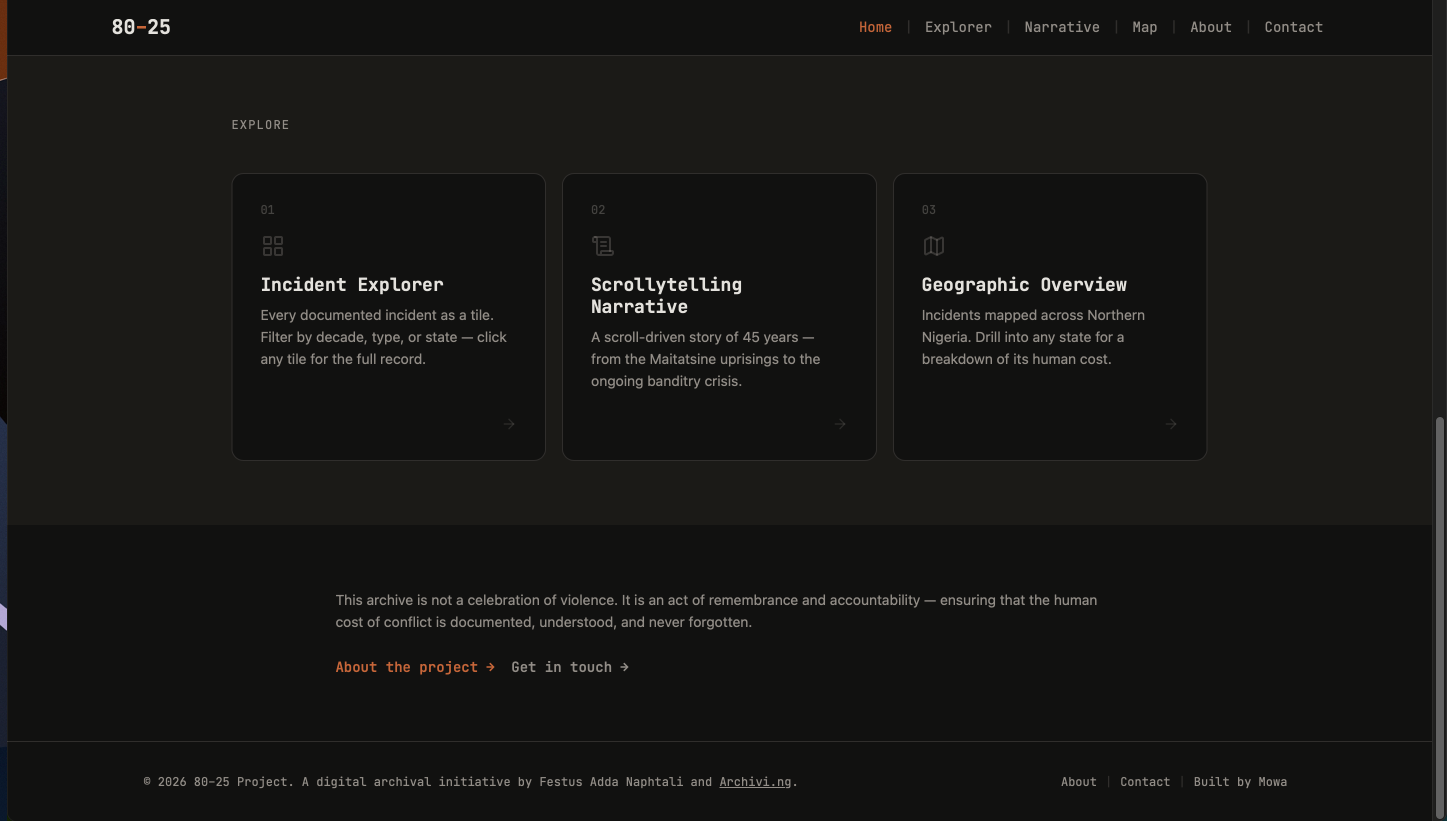
- Scrollytelling narrative. A decade-by-decade story of recurring conflict, each beat tied to sourced incidents.
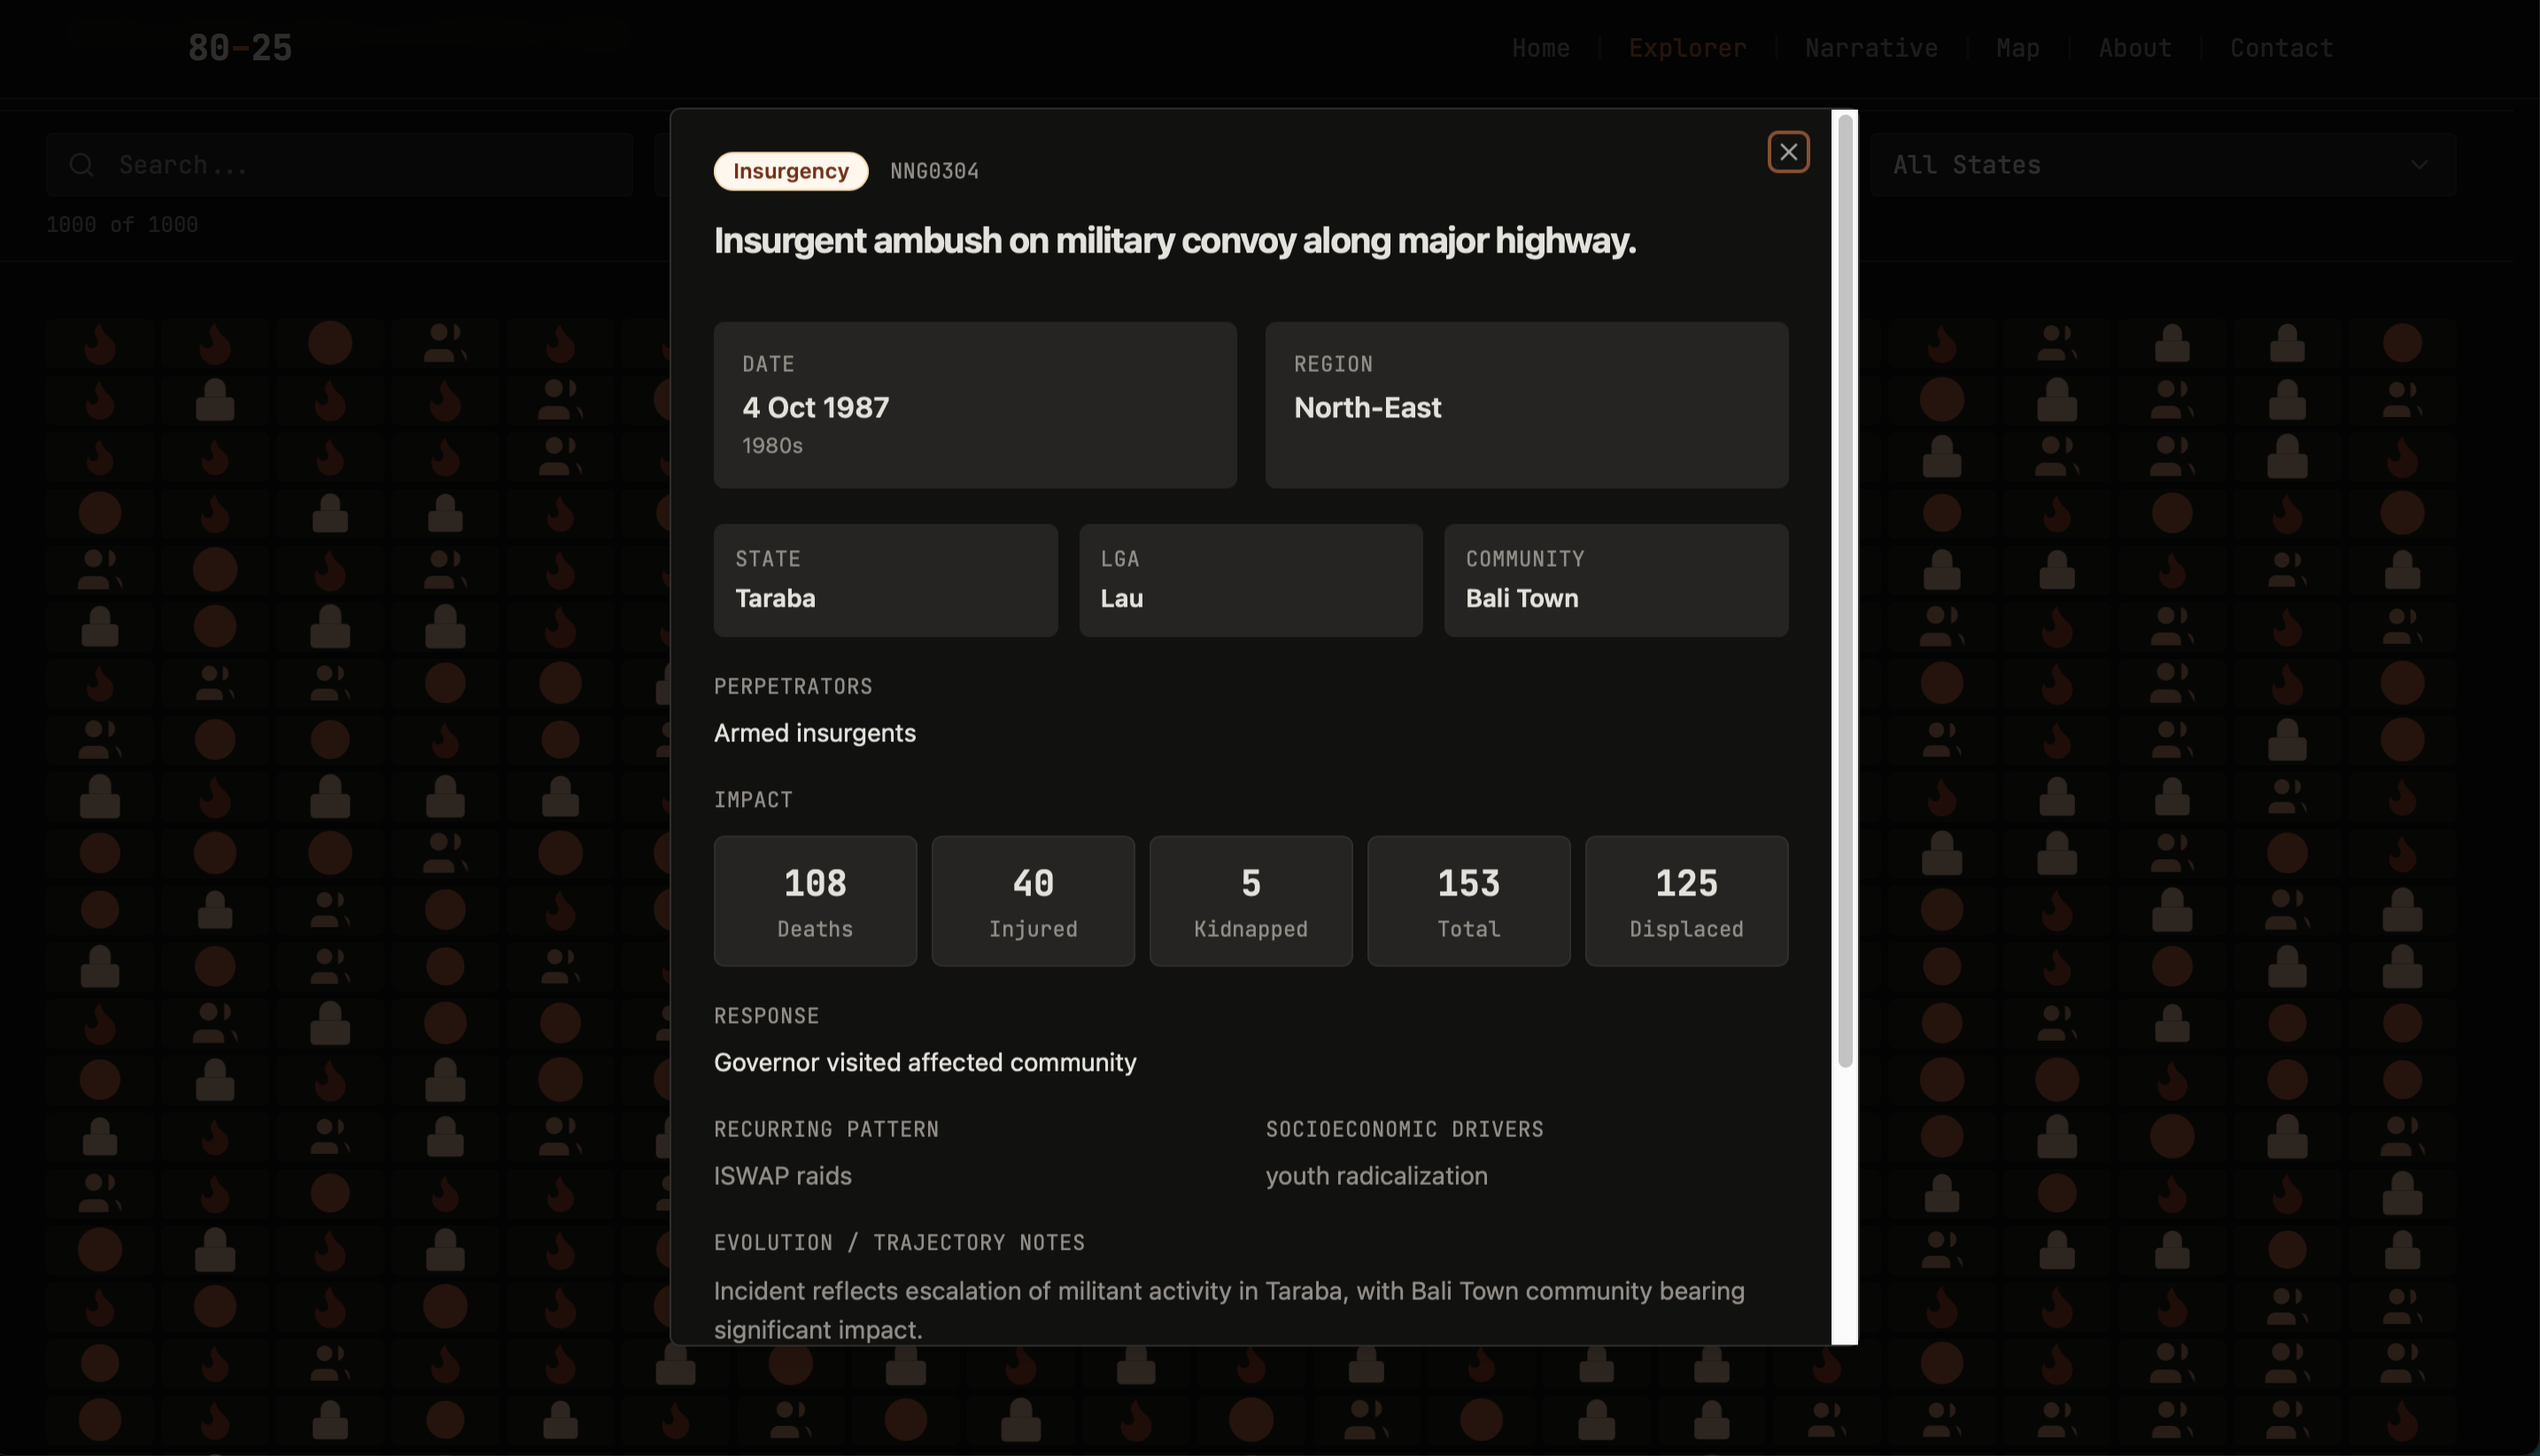
- Incident Explorer. Every incident as a filterable tile. Open one for the full record.
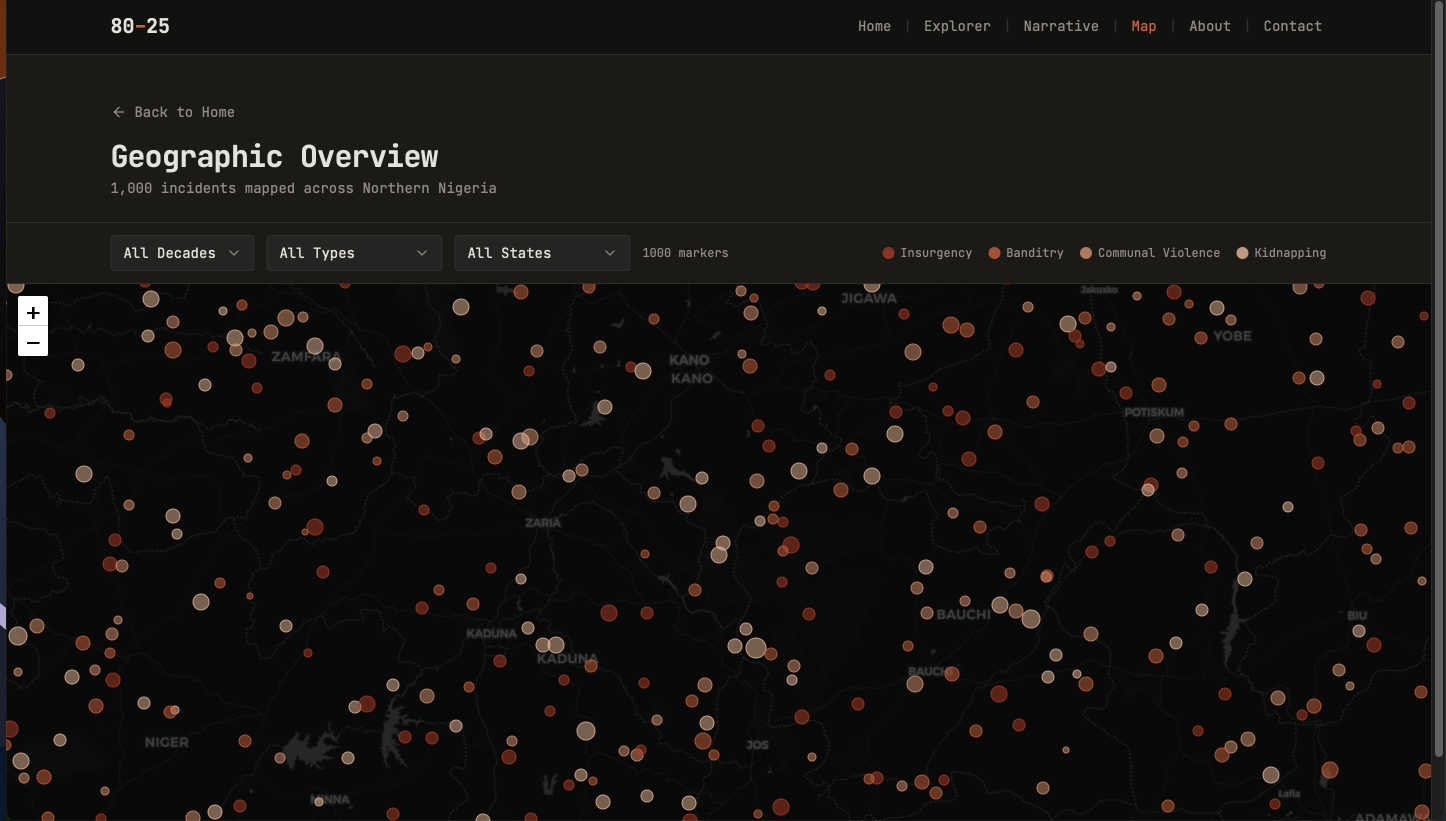
- The incident map. Each incident geolocated and colour-coded by type.
- Light or dark. The whole archive in a light or a dark theme.
Type
Digital Archive & Data Visualisation
Capabilities
Stack
Key features
Overview
80-25 was built for Festus Adda Naphtali, a fellow at Archivi.ng who had spent years compiling over 1,000 documented security incidents across Northern Nigeria.
The product is structured around three entry points to the same dataset. An Incident Explorer presents every record as a filterable tile grid, a Scrollytelling Narrative walks through five decades with animated canvas visualisations and a comparison table of conflict patterns, and a Geographic Overview is built on Leaflet with CartoDB dark tiles. Every page, including the timeline bars on the homepage, reads from a single JSON file. When the dataset updates, the entire product updates with it.
Why it was built
Northern Nigeria has experienced repeated cycles of insurgency, banditry, and communal violence for over four decades. Documentation of these events sits fragmented across news archives, NGO reports, and academic papers. 80-25 was built to consolidate that record into a single, navigable dataset and make it legible to researchers, journalists, and the public.
Inside the product
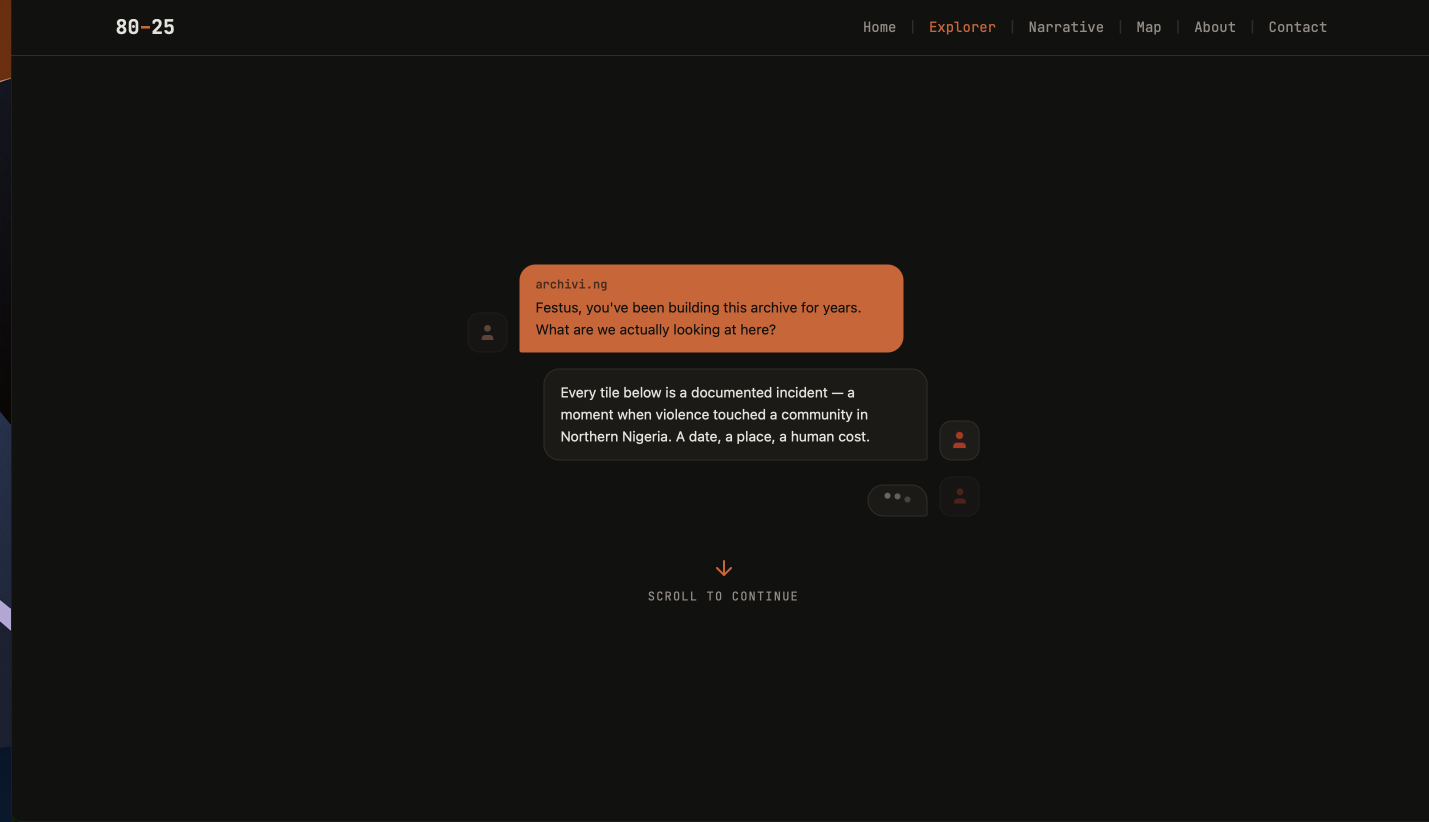
Explorer
A conversation-driven interface where users specify filters (decade, incident type, state) and get back a tiled grid of matching incidents. Clicking a tile opens a detail panel.
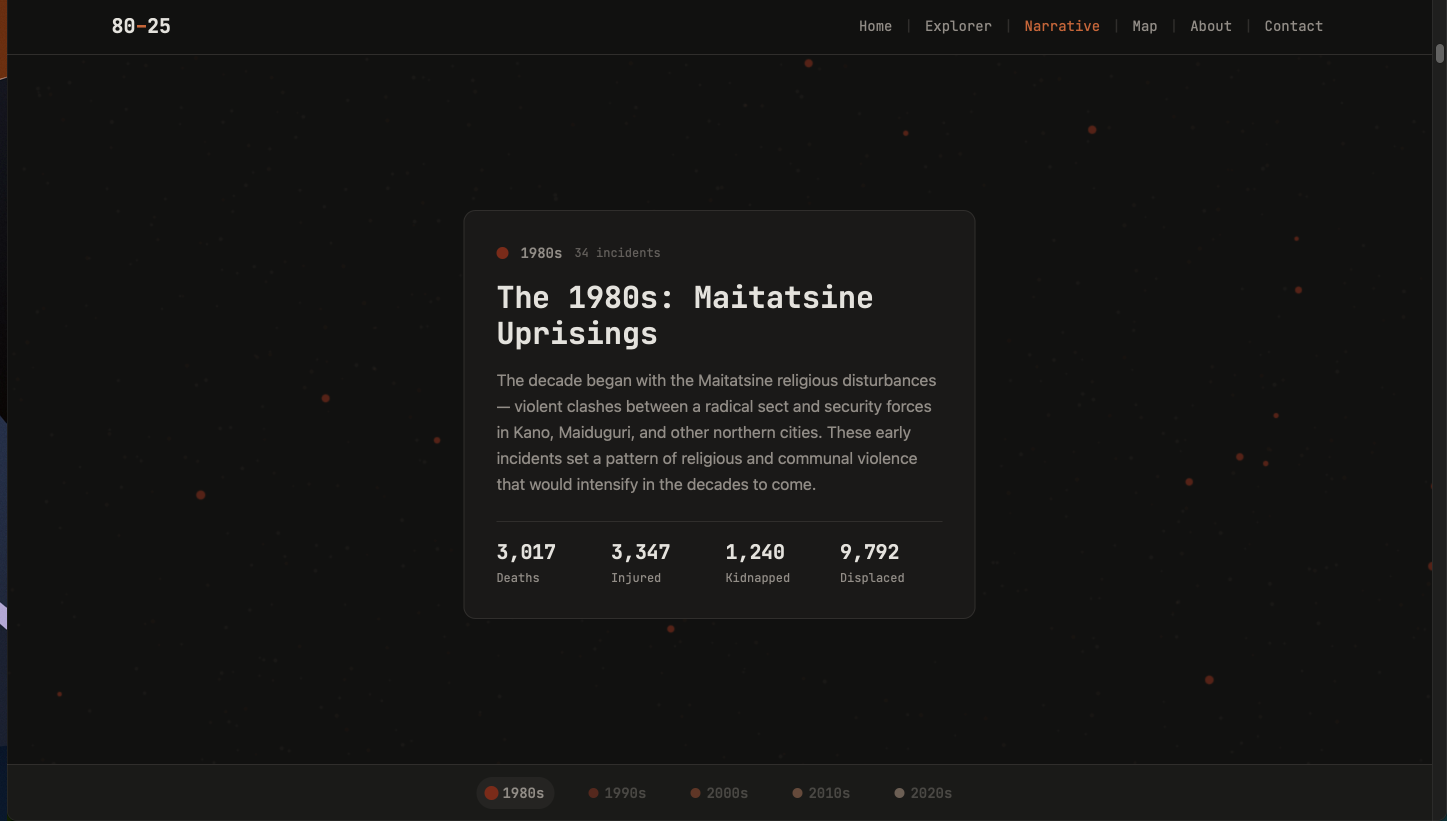
Narrative
A scrollytelling page with an animated dot canvas that reacts to the reader's scroll position, plus a data-driven comparison table across the three major conflict eras.
Map
A geographic view plotting all incidents by state.
Results
- 1,000+ incidents documented across 45 years.
- Three interconnected views (Explorer, Narrative, Map) from a single data source.
- Covers Maitatsine, Boko Haram, farmer-herder conflict, banditry, and kidnapping.
Next project
Oriire →